|
Presentation: docs.google.com/presentation/d/1i5VF3bMfu_h_d0PYLIdovnfsvY7o4k0QndkRG1NJxhc/edit?usp=sharing LipNet Fail Documentation: https://drive.google.com/open?id=1Q7S_WT5TUi6HIvtflmn9Lu9mLy-UNANS One Sentence Description: A study on LipNet including: a failed setup process, application ideas, and thoughts. Summary: A study on LipNet detailing my failed installation process, emotion tracking, future application ideas, and overall thoughts. LipNet is a recurrent network with the “first end-to-end sentence-level lipreading model that simultaneously learns spatiotemporal visual features and a sequence model” meaning it can lipread based on where the users mouth moves visually (Cornell 1). Some codes were tweaked to fit a PC as the original documentation was done on a Mac. To run python, I used PowerShell. I attempted to follow the Keras implementation of LipNet where the model was trained on multiple images and videos of multiple different people mouth words. LipNet then outputs the text as what it believes the user mouthed-the result that I wanted. The step that caused me to discontinue my setup process was when I was unable to get the system to recognize the ffmpeg that had been installed and previously working. Other setup difficulties are discussed. Based on the original LipNet, I built an application that classifies the user as “Mad,” “Happy,” or “Excited” based on the user’s facial expression. The project uses facial tracking points to train the model and the model then classifies the data-images-collected. The project uses ML5.js in p5.js to run. Future applications include ideas in the fields of technology, surveillance, and medical fields. My inspiration was a previous project I had done in my Code of Music class last semester. The project was based around helping those who are deaf or hard of hearing, be able to see music visually. Inspiration: In high school, I had a friend who wasn't deaf, but needed a hearing aid to hear. She was always afraid of going completely deaf and being isolated from the rest of the word. Last year for my Code of Music final project, I created a physical device that put intonation on braille. The device had an LCD for display and 4 LEDs for each amplitude, frequency, and waveform to display the results in real time. I wanted to try to find another way to visualize sound so she and people like her never have to worry about this again. Process: Setting up LipNet on a PC is painful, but very educational. Though I was unable to train a model on LipNet, setting it up in PowerShell taught me a lot about coding logic and python. At the end, I was unable to get the system to recognize the ffmpeg although I had downloaded it. I believe most of my problems were because I used a PC when a majority of the-minimally existing-documentation was done on a Mac. While making my alternative project, a new set of problems arose. I found that the hardest part was getting emotion tracking to work. Because the human face is only so big, an alternative method may have been easier to work it. Audience: My audience is those who participate in the fields of technology, surveillance, and medicine. Lip reading can be used as a new way to communicate with digital assistants, military level spying, and for those who are deaf. User Testing: After having my friend user test my alternative project, I discovered that I needed more samples in my dataset. After adding more images, the project's accuracy improved-but, not significantly. This probably because facial emotion tracking is unreliable. Code References: https://editor.p5js.org/[email protected]/sketches/sY7K7UNQe https://github.com/rizkiarm/LipNet/blob/master/README.md https://github.com/keras-team/keras/blob/master/keras/optimizers.py https://github.com/osalinasv/lipnet https://github.com/ski-net/lipnet Next Steps:
My next steps would be to try to install LipNet on a Mac and to add more emotion categories in my alternative project.
0 Comments
Questions:
Does the dataset contain data that might be considered confidential? Because of the variety and large size of the dataset, there may be confidential information. However, it is highly unlikely that a large part of the data contains sensitive information because it is being used by common people. Even if there is confidential information, it is probably very hard to pinpoint accurately. Does the dataset contain data that, if viewed directly, might be offensive, insulting, threatening, or might otherwise cause anxiety? The answer is yes despite my opinion. With the dataset containing 50 million drawing across 345 categories by players all over the world, someone will be unhappy with this dataset. From an objective opinion, none of this data should be offensive because it is not being used in an offensive way. It is purely used for entertainment or education. Does the dataset identify any subpopulations of people (e.g., by age, gender)? This dataset is used all over the world by a large variety of people, therefore it should include all subpopulations with respect to the (world) population at hand. Were individuals (e.g. players of Quick, Draw!) notified about the data collection? Did these individuals in question consent to the collection and use of their data? The Google Quick Draw dataset contains 50 million drawing across 345 categories by players all over the world. Because this dataset was collected by players of the game “Quick, Draw!,” there may be some liability issues. If data is being collected, the company must alert the player so they are able to determine if and what they would like released. This is called transparency. If consent was obtained, were the consenting individuals provided with a mechanism to revoke their consent in the future or for certain uses? If players do consent to their data being used, the company should provide a way for users to revoke their consent if they choose. While I am unsure of Quick Draw’s data collection process, I infer that it is highly unlikely that revoking consent is an option due to the difficulty of sifting through such a heavy load of data. Are there tasks for which the dataset should not be used? The dataset should not be used in any applications that may put other people’s security at risk. Coding Exercise: This week I fixed my last week’s project. The project is now able to tell if a person is tired, hungry, or stressed based on the location of the user’s face on the screen. I fixed this by changing to the new ml5.js version and by changing my if statements to “else if” statements. Link: https://editor.p5js.org/[email protected]/sketches/WcWuPxb3b Title: Lipreading Machine One sentence description: A lip reader that generates text. Project Abstract: My project is a machine that is able to lip read. The user would mouth words as the input and the machine would generate the words the user mouthed through text. LipNet is a recurrent network with the “first end-to-end sentence-level lipreading model that simultaneously learns spatiotemporal visual features and a sequence model” meaning it can lipread based on where the users mouth moves visually (Cornell 1). The LipNet model also resembles the Face-landmarks model on Runway ML which tracks a user's face with points on specific facial features. This can be applied to a variety of fields, especially medical, interactive, and day-to-day practical fields.. Deaf patients under emergency care may be able to better interact with doctors and nurses to voice their needs. It can also be applied to smartphones as a new way to interact with digital assistants such as Alexa, Siri, or Echo. These assistants all require the user to voice their commands before the assistant responds accordingly, but with LipNet, the user may be able to avoid making any noise. While this is not proprietary, convenience is one of the leading driving forces for consumer goods. The convenience of being able to silently communicate with an assistant may be the next big thing. The biggest challenge in this project, for me, is figuring out python. Because I’ve primarily worked with Javascript in the past, this will be a new learning process for me. Another challenge is finding an alternative for CUDA given I have a PC. Inspiration: In high school, I had a friend who wasn't deaf, but needed a hearing aid to hear. She was always afraid of going completely deaf and being isolated from the rest of the word. Last year for my Code of Music final project, I created a physical device that put intonation on braille. The device had an LCD for display and 4 LEDs for each amplitude, frequency, and waveform to display the results in real time. I wanted to try to find another way to visualize sound so she and people like her never have to worry about this again. Short Explanation: Below is an image of the Keras implementation of LipNet (link below). The model was trained on multiple images and videos of multiple different people mouth words. LipNet outputed the text as what it believes the user mouthed. 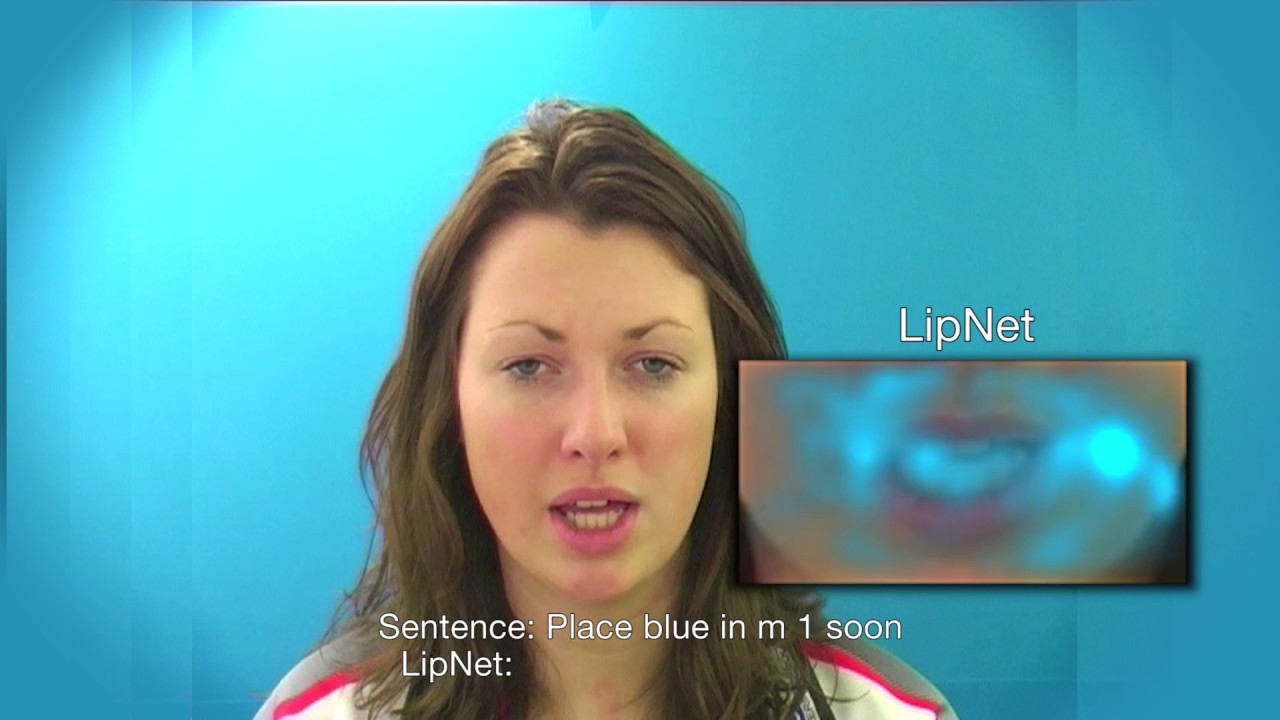 This week I tried the CycleGAN, style transfer, automatic colorization, and StyleGAN in Runway ML.In all the instances I could get communication between p5.js and Runway, but the output would never load. Previously, I was getting the error type as "failed to fetch," but this week the images just didn't load. The model would say it's done running and not load anything. The sketch worked in class, but I plan to recheck my code for errors.
Adaptive Style Transfer: 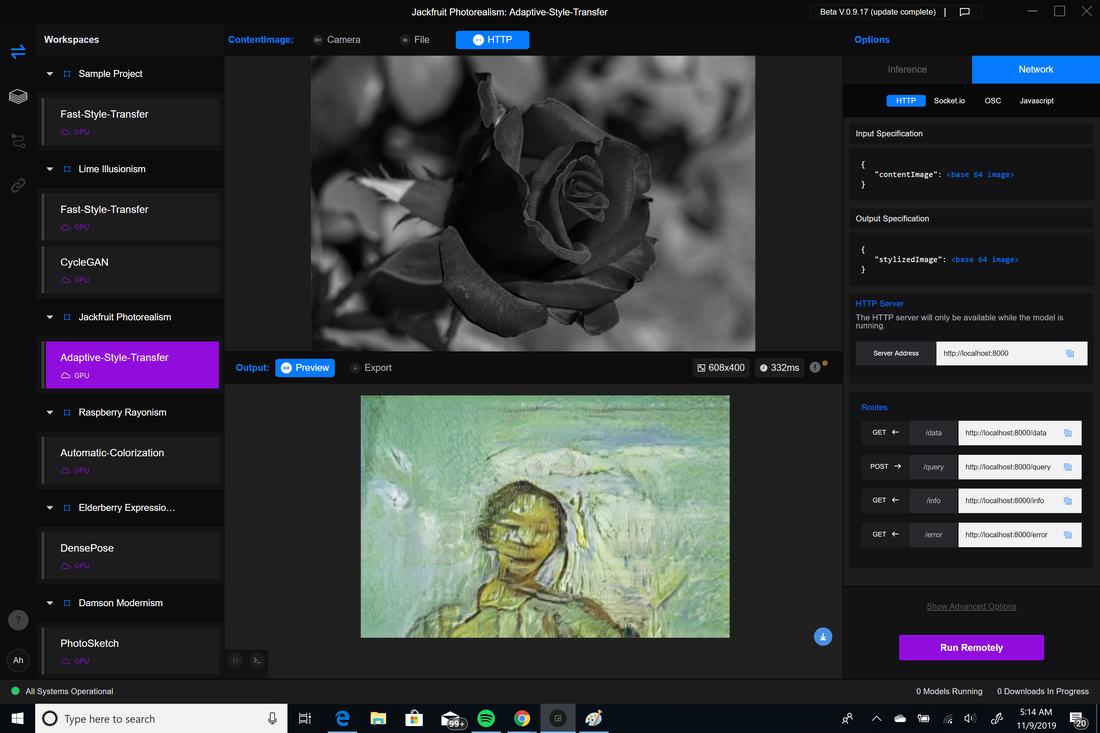 Automatic Colorization: 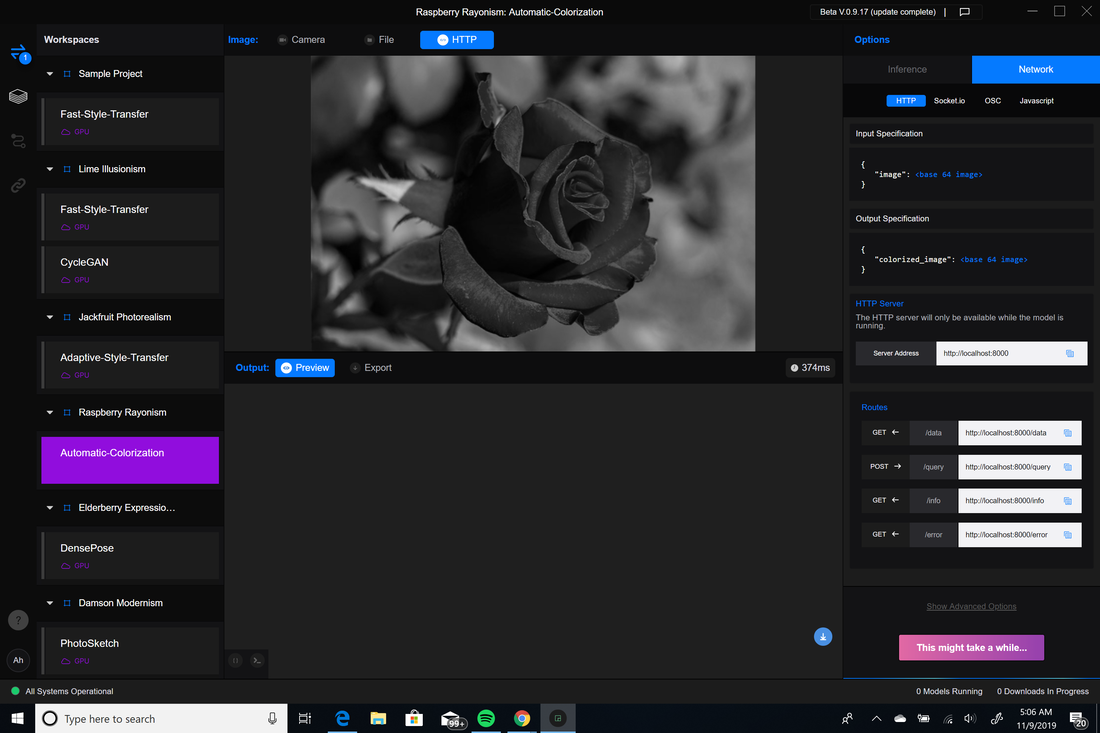 CycleGAN: 
In Robin Sloan's 2017 Eyeo talk, he explains to us that it is not about trying to fit the model, but rather to have the model fit your needs. He demos a model trained on science fiction to generate the next part of his sentences. If the words the model generate don't make sense he either deletes part or all of the generated text. Before watching this talk, I didn't even realize that I was always trying to pick the most convenient data set rather than edit or condense a better data set. I now realize how nonsensical an inconvenient it is to use a data set that doesn't fit. The Subtext of a Black Corpus In conversation with ITP SIRs Nikita Huggins & Ayodamola Okunseinde by Ashley Lewis, the authors talk about the inclusiveness of black cultural in data sets. She questions “if Google translate is for everybody than why can’t it understand my dialect?” While there are many data sets, even Google managed to miss certain dialects. Data sets need to include all types of people and should not be referenced from only one source. To combat this, the two authors have developed a prototyping workshop that takes students step by step through designing data sets while also considering problems surrounding racial and gender bias. In Adventures in Narrated Reality 1&2 by Ross Goodwin, he tells the story of how his laziness guided him to a new passion. While searching for a quicker way to write speeches for clients he did not like, Goodwin stumbled upon machine learning and the convenience it could offer. While watching "Sunspring," I sat there for the majority of the video trying to figure out if it was me that was confused or the video genuinely was a little weird. After figuring out that the script was generated by Char-RNN, everything started to make more sense. This makes me question how a model would be able to decipher words that have a double meaning or slang words and what this would look like on an interactive model.
Aside from using sketchRNN for games, I thought it could be used for police suspect sketches. When a person says a certain set of words as a description, sketchRNN would automatically draw it based on what the person describes. My first thought to carry this idea out was to use p5.speech and p5.speechrec, but then I realized this could also be done more easily if the user types their description instead of saying it. To do this, I implemented an input box where the user can type and search what they want. I tried assigning a variable to the name slot in the sketchRNN and putting the variable in an array, but no matter what I tried it would either draw something I couldn't recognize or nothing. 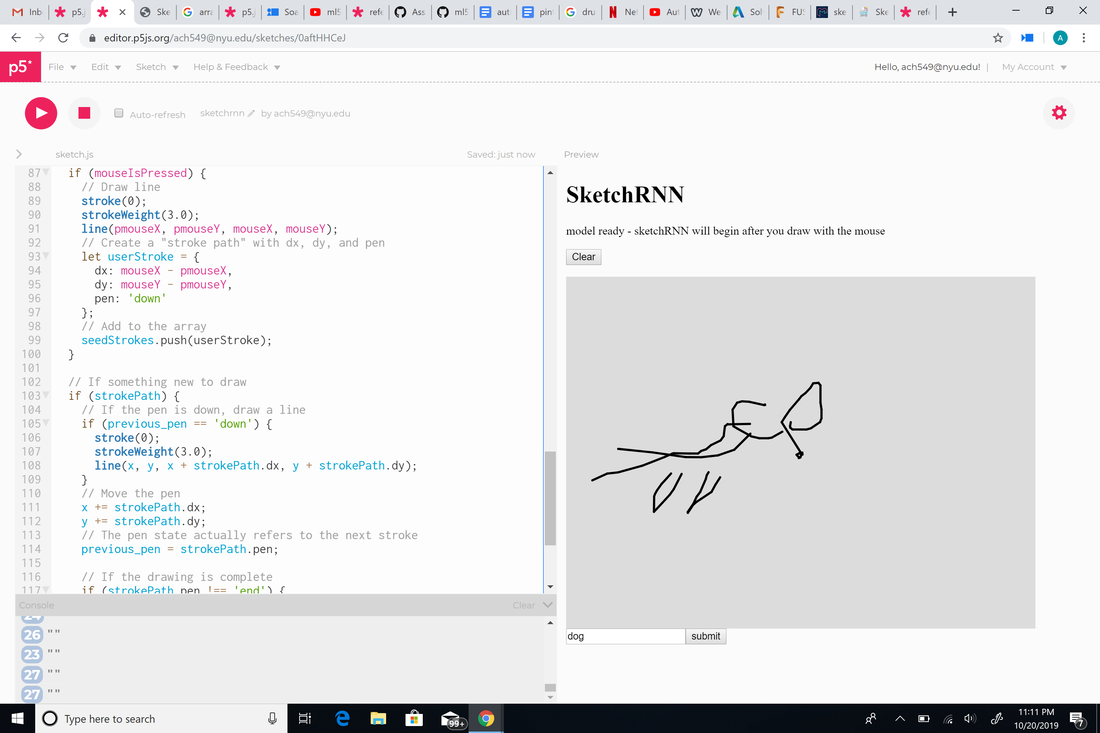 While AI has made our lives easier in countless ways, it does leave a large ethical dilemma. One could say it would eliminate risk of human error, but what if it really is wrong? That would lead to too much controversy especially when a person's life could be on the line.
In Machine Learning for Human Creative Practice, Dr. Rebecca Fiebrink poses the question "How can machine learning support people's existing creative practices? Expand people's creative capabilities?" Machine learning learning allows artists to focus on the creative side rather than worrying about execution. Because creating an algorithm from scratch is becoming more and more obsolete, AI is no longer limited to programmers and mathematicians. Even a respected programmer in the video, spoke on how he felt that he no longer needed to think in a mathematical way anymore. With this increased access to machine learning, artists are able create a new user experience with these new forms of digital interaction. Dream Idea This week really opened my eyes to the vast amount of applications AI-specifically machine learning-can have. Last year, I worked on a project that used p5.speech and p5.speechrec for voice recognition. This project allowed a user to speak into a microphone and have their words transcribed on the screen. This led me to question how machine learning could be used as assistive technology. I came up with the idea of a lip reading machine that could say and display what the user was mouthing. The input would be a user mouthing words without making any noise and the output would be the sounds and display of the words the user mouthed. Before starting my project, I decided to google if a lip reading model already existed. I found that in 2016, Researchers from Google’s AI division DeepMind and the University of Oxford created the "most accurate lip reading software"-for their time-with a 46.8% accuracy. When I first read it, it was a bit weird to consider a less than 50% accuracy as accurate, but this shows how far machine learning has come and has to go. More information on this in the link below. www.theverge.com/2016/11/24/13740798/google-deepmind-ai-lip-reading-tv This week I tried to make a very simple version of my dream concept. Originally, I decided to split the camera capture into 7 parts-for 7 of the most commonly used English letters-and train the machine to output a letter-along with a frequency sound-that could be used to spell out a word. The sketch worked when I had 2 letters, but as I added more, the letters stopped appearing. I believe this is because I didn't train the model well enough, but after training it multiple times I still had the same problem. I added console.log() and saw that maybe the numbers were coming in too fast and p5 was getting slowed down. To cut down the output letters I tried changing the outputs into words, but the no letters or words would load after that. This could be a fluke, but I noticed using words also increased the training time on my model. Another problem I had was getting the words to stay on the screen. When it was working, the letters would only occasionally blink even if I was still within my set code boundaries.
p5: editor.p5js.org/[email protected]/sketches/WcWuPxb3b p5: editor.p5js.org/[email protected]/sketches/LxcTlnub_ Cleaned fars data: docs.google.com/spreadsheets/d/1kqsd_KGIqW2djpnB4j6OrTwMT_P8TzSnibXyL-oeaFk/edit?usp=sharing After playing around with the titanic dataset, I discovered a few strange things. The only first class person I could get to die was the 32 year old woman with a 100 dollar fare. But, when I changed it to a 50 year old woman or a 19 year old man, they all were predicted to live. As I decreased the fare, more and more people began to die. I then decided to use the "fars" dataset on OpenML. I clicked on the link (https://data.world/nhtsa/fars-data) given on the OpenML fars dataset page to discover that it is a dataset of American traffic crashes and it is used to analyze and find safety countermeasures to prevent traffic fatalities. To qualify as a traffic accident in the dataset, the crash "must involve a motor vehicle traveling a traffic-way customarily open to the public and resulting in the death of a person (occupant of a vehicle or a non-motorist) within 30 days of the crash." Each crash in the dataset has over 100 coded data "that characterize the crash, the vehicles, and the people involved." Overall, I felt that the fars dataset is much more straightforward and simple. I cleaned it by following the data wrangling tutorial for the "sex" column of the dataset to convert 0 and 1 into male and female. But, I could only get the data to classify it as male or false. Because the fars dataset was originally far too big to import into p5, when I cleaned it, I also minimized the data in the link down below too see if it was my p5 sketch that was the problem or my data. Cleaned fars Data: docs.google.com/spreadsheets/d/1kqsd_KGIqW2djpnB4j6OrTwMT_P8TzSnibXyL-oeaFk/edit?usp=sharing 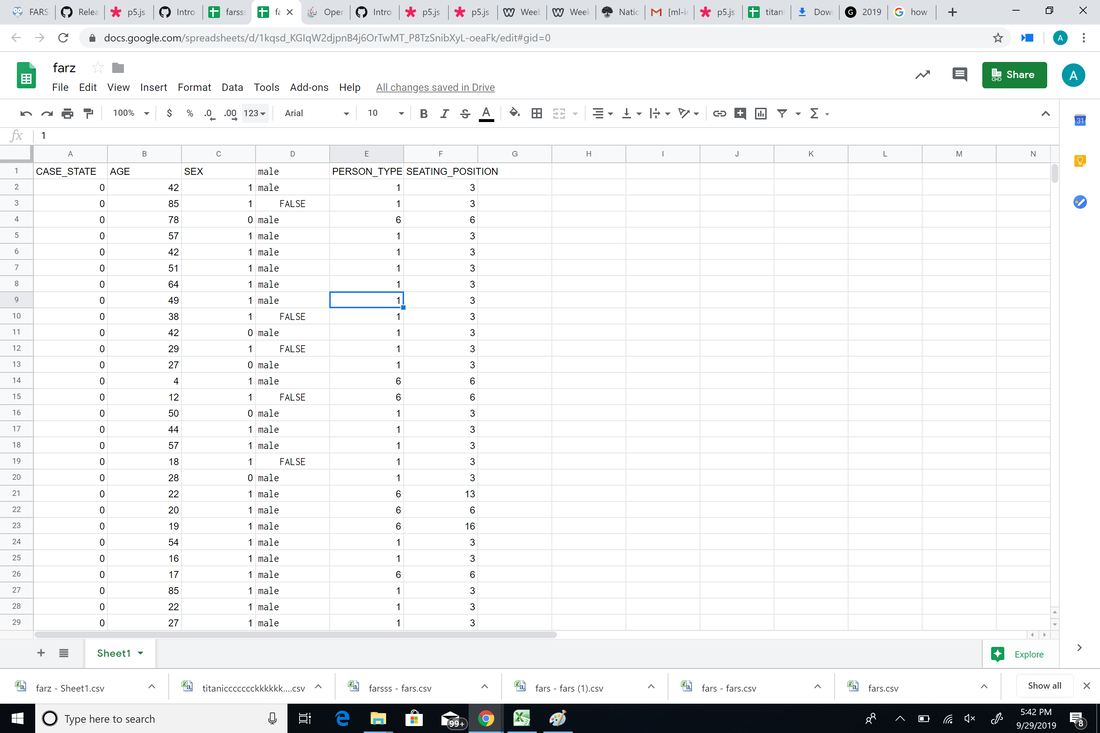 After cleaning, I imported it into p5 where the csv data came up. However, even after trying 3 different datasets, I kept getting the error 'TypeError: Cannot read property 'predict' of undefined." 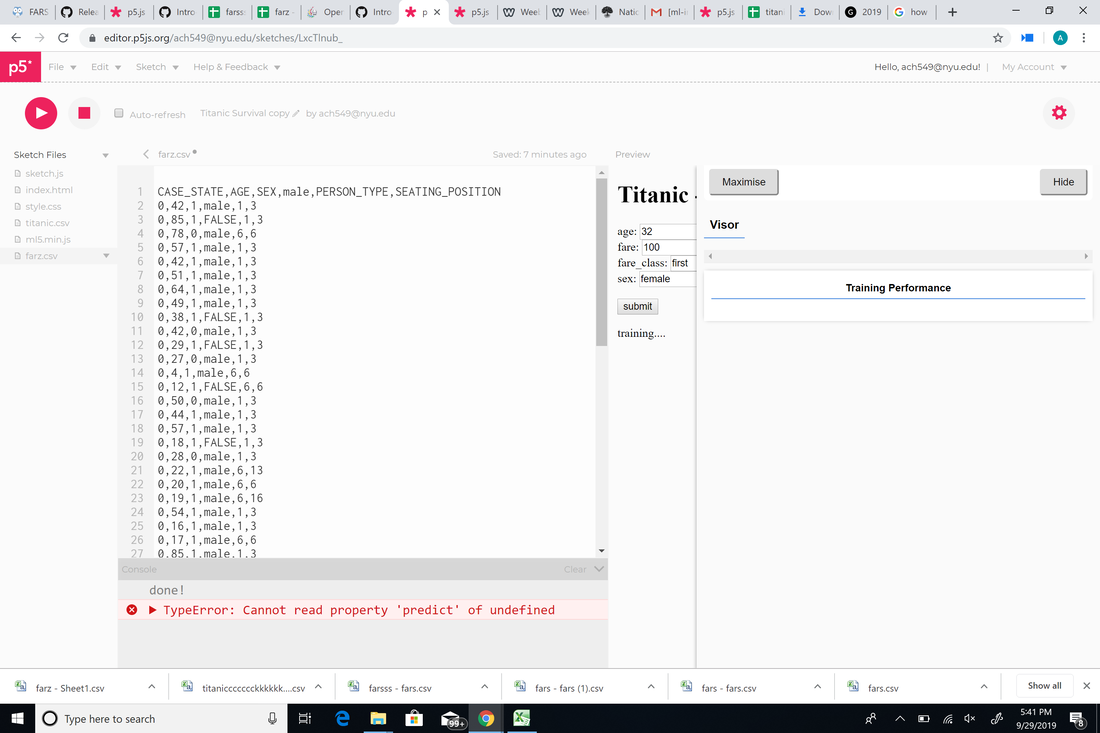 Dataset: https://www.kaggle.com/aaronschlegel/austin-animal-center-shelter-outcomes-and What is (are!) the data?The dataset contains shelter outcomes of several types of animals and breeds from 10/1/2013 to the present with a hourly time frequency. The data is updated daily. The Austin Animal Center's original dataset includes columns for name, date of birth, outcome, animal type, sex and age at time of outcome, breed, and color. Outcomes range widely and include things like adoptions and transfers to other shelters. "Outcomes represent the status of animals as they leave the Animal Center. All animals receive a unique Animal ID during intake. Annually over 90% of animals entering the center, are adopted, transferred to rescue or returned to their owners. The Outcomes data set reflects that Austin, TX. is the largest "No Kill" city in the country." What format is the data in? (CSV, JSON, PDF, or . . ) CSV What are the dimensions of the data (rows and columns)? 29.4k rows and 37 columns What are the "variables" (also known as "data items"). In a CSV these would be the column headings. Do you recognize the data types (numbers, strings, images, etc.)? * Is there missing, incorrect, or otherwise problematic data? This dataset only contains animals that have been counted when entering the city. It is likely there is a large percentage of shelter cats/kittens in Austin that have been unaccounted for. How and why was this data collected? The Official City of Austin Open Air Portal states that data columns included-but were not limited to-an animal's breed, sex, age, and DOB. For whom is this data accurate or useful? What is this data unrepresentative of? (Who is missing and left out of the data?) This data is useful for people looking to adopt a cat/kitten. However, the data is unrepresentative to the number of homeless cats that are really out there. Many are unaccounted for and may never find homes. Knowing what you know now about machine learning, what will a model trained on this data help you do? Are there are alternative (non-machine learning) methods you could use instead? A model trained on this data could consist of tracking a distinct feature found only on cats. Tracking a distinct feature or pose, a scan could be performed over the larger forest regions to see if there are any matches. References: https://www.kaggle.com/aaronschlegel/austin-animal-center-shelter-outcomes-and https://data.austintexas.gov/Health-and-Community-Services/Austin-Animal-Center-Outcomes/9t4d-g238 After looking at the COCO Dataset this week, I noticed how different it is from ImageNet. To me, the two biggest differences between the two data sets are loading time and accuracy. While I felt ImageNet could've been more accurate, the results were-more often than not-an item that somewhat matched the search. But in COCO, I discovered that there were hardly any images that were related to what I had intended to look up. I thought using simple words like "blue" and "flower" would give more explicit answers, but even with those I found not to be too accurate. I'm curious to know how COCO's algorithm works and why it takes so long to load their results. Some ethical concerns would definitely be where these images came from and whether it was consensual use. For this week, Cass and I wanted to explore what could be the visual effect that a led could represent of. The idea of a pulsing energy ball came up, so we decided to have the size some other visual effects change when we move the distance in between our hands.
In the p5 sketch, we used poseNet to locate the xy position of both hands. Although we did get the data of left and right hands’ wrist positions, there is a problem with accuracy here. We set the threshold for the value of the confidence score as 0.2, just like the posenet example does. However, it did not work so well on our sketch that we have to set the score back to 0.05 and it’s still not stable (I also applied leap() function) whereas on the example sketch it works pretty smooth with the threshold set to 0.2. Then after that, we calculated the midpoint value of two hands so we got a center to draw an ellipse (the actual y location is lower because we want the ball to be in the center of the hands but not the wrist) The original plan was to give this outByte data two jobs. One is to contribute to the brightness of led so that when the energy ball we create gets smaller, the led light gets brighter, representing the energy density within the ball. And the other one is to control the delay time to have the LED twinkle – when the ball gets smaller, it twinkles more rapidly, representing the intensity. However later we found its not so necessary to set a parameter for this because the when two hands get closer (when the ball gets smaller), the position given by poseNet is more unstable, which causes the value of the date jump around, dramatically resulting in a twinkling effect. Also, another issue we encountered was about serial connecting. The newest serial controller does not work on the computer so we have to use the old one. And also, the data I got from the Arduino is very messy – there are a bunch of random numbers (from like 0-80) showing on the console.log. The real data is kind of mixed with them but luckily it seems to only happen in the console log and does not effect the plan. p5 Link: https://editor.p5js.org/[email protected]/sketches/GQ9xWhi7t Documentation: https://www.youtube.com/watch?v=eCwyxgF8AG4&feature=youtu.be |
AuthorWrite something about yourself. No need to be fancy, just an overview. Archives
December 2019
Categories |


 RSS Feed
